densitty
densitty package
densitty.plot
Two-dimensional histogram (density plot) with textual output.
class densitty.plot.Plot(data, color_map, render_halfheight, font_mapping, min_data, max_data, x_axis, y_axis, flip_y)
Create a textual 2-D density/histogram plot given binned data.
data: Two-dimensional values (e.g. list of lists of floats)color_map: One of the above color maps (Default: 256-color grayscale)render_halfheight: Bool indicating whether to use half-block characters to double the vertical resolution (Default: True)font_mapping: character/glyph mapping based on terminal capabilities (Default: lineart.basic_font)min_data: Data value that should correspond to minimum colormax_data: Data value that should correspond to maximum colorx_axis: Axis object for X axisy_axis: Axis object for Y axisflip_y: Output minimum Y as first line (Default: True)
as_strings()
Scale the data to 0..1 range and feed it through the appropriate output function to produce the plot. Returns a list of strings (one per line).
show(printer)
Simple helper function to output/print a plot. Calls as_strings() and outputs each line with the printer function.
printer: Function to use for output. Default:print()
upscale(max_size, max_expansion, keep_aspect_ratio)
Scale up ‘data’ by repeating lines and values within lines.
max_size- If positive: Maximum number of columns, maximum number of rows
- If zero: Use terminal size
- If negative: Use as offset from terminal size
- Default: Based on terminal size (0)
max_expansion(default (3,3))- Maximum expansion factor in each direction. 0 implies no maximum
keep_aspect_ratio(default False)- Require that X and Y scaling are equal
densitty.axis
Axis-generation support.
class densitty.axis.Axis(value_range, labels, label_fmt, border_line, values_are_edges, fractional_tick_pos)
value_range: Tuple/List/util.ValueRange with the Axis limitslabels: dict of coordinate value -> string to print as axis label. If None (default), labels will be autogeneratedlabel_fmt: For autogenerated labels, specifies the number formatting, e.g. ‘’. Default{}border_line: Include a line along the axis in the output. Default Falsevalues_are_edges: True for histogram-like data, where labeled values are typically the edges of the histogram bins. Default Falsefractional_tick_pos: Use various characters to indicate where an axis tick is, rather than just “-“ or “|”. Default False
densitty.binning
densitty.binning.histogram2d(points, bins, ranges, align, drop_outside, **axis_args)
Bin points into a 2-D histogram, given number of bins, or bin edges
points: Sequence of (X,Y) tuples- The points to bin
bins: int or (int, int) or [float,…] or ([float,…], [float,…])- If int: number of bins for both X & Y (default: 10)
- If (int,int): number of bins in X, number of bins in Y
- If list[float]: bin edges for both X & Y
- If (list[float], list[float]): bin edges for X, bin edges for Y
ranges: Optional (ValueRange, ValueRange)- ((x_min, x_max), (y_min, y_max)) for the bins
- If None (default): take from data.
bin_sizes: float or tuple(float, float)- Size(s) of (X,Y) bins to partition into
- If tuple: (x_bin_size, y_bin_size). If single number, the bin size in both directions
align: bool (default: True)- Pick bin edges at ‘round’ values
drop_outside: bool- True (default): Drop any data points outside the ranges
- False: Put any outside points in closest bin (i.e. edge bins include outliers)
axis_args: Extra arguments to pass through to Axis constructor
returns tuple: (Sequence[Sequence[int]], (x-)Axis, (y-)Axis)
densitty.smoothing
Support for smoothing pointwise data for a density map.
densitty.smoothing.gaussian_with_inv_cov(inv_cov)
Produce a Gaussian (normal) smoothing kernel, given an inverse covariance matrix
densitty.smoothing.gaussian_with_sigmas(sigma_x, sigma_y)
Produce a Gaussian (normal) smoothing kernel, given widths in X and Y
densitty.smoothing.triangle(width_x, width_y)
Produce a triangular smoothing kernel with given widths
densitty.smoothing.smooth2d(points, kernel, bins, ranges, align, **axis_args)
points: Sequence of (X,Y) tuples- The data points to be smoothed
kernel: SmoothingFunc- The kernel to use for smoothing
bins: int or (int, int) or [float,…] or ([float,…], [float,…])- If int: number of output rows & columns (default: 10)
- If (int,int): number of columns, number of rows
- If list[float]: column (x) & row (y) coordinate values
- If (list[float], list[float]): column (x) coordinate values, row (y) coordinate values
ranges: Optional (ValueRange, ValueRange)- ((x_min, x_max), (y_min, y_max)) for the columns/rows
- If None (default): take from data.
align: bool (default: True)- Pick column/row centers at ‘round’ values
axis_args: Extra arguments to pass through to Axis constructor
densitty.detect module
Utility functions to try to detect terminal/font capabilities
Enum densitty.detect.ColorSupport
- NONE = 1
- ANSI_4BIT = 2
- ANSI_8BIT = 3
- ANSI_24BIT = 4
Flag densitty.detect.GlyphSupport
Varieties of terminal/font glyph rendering support
- ASCII = 1
- BASIC = 2
- COMBINING = 8
- EXTENDED = 4
densitty.detect.color_support(interactive, debug)
Try to determine the terminal’s color support.
interactive: bool- Send control codes to terminal if needed to query capability/version. For a sufficiently dumb terminal, this may produce garbage on the screen
debug: bool- Output feedback to stdout about the determination logic.
Returns ColorSupport
densitty.detect.combining_support(debug)
Detect support for combining unicode characters by seeing how far cursor advances when we output one. See ucs-detect / blessed projects for more full-featured detection
Colormap Dictionaries
Some dicts mapping ColorSupport level to Color Maps are provided:
detect.GRAYSCALE
Maps to Truecolor / 256-color Grayscale, or to ASCII-Art
detect.FADE_IN
Maps to appropriate TrueColor/256-Color/16-color FADE_IN (Black -> Purple -> Blue -> Green -> Yellow -> Orange -> Red), or ASCII-art.
detect.REV_RAINBOW
Maps to appropriate TrueColor/256-Color/16-color REV_RAINBOW (Purple -> Blue -> Green -> Yellow -> Orange -> Red), or ASCII-art.
densitty.detect.histplot2d(points, bins, ranges, align, drop_outside, colors, border_line, fractional_tick_pos, scale, **plotargs)
Also exported as densitty.histplot2d()
Wrapper for binning.histogram2d / plot.Plot to simplify 2-D histogram plotting
points: Sequence of (X,Y) tuples- The points to bin
bins: int or (int, int) or [float,…] or ([float,…], [float,…])- If int: number of bins for both X & Y (default: 10)
- If (int,int): number of bins in X, number of bins in Y
- If list[float]: bin edges for both X & Y
- If (list[float], list[float]): bin edges for X, bin edges for Y
ranges: Optional (ValueRange, ValueRange)- ((x_min, x_max), (y_min, y_max)) for the bins if # of bins is provided
- If None (default): take from data.
bin_sizes: float or tuple(float, float)- Size(s) of (X,Y) bins to partition into
- If tuple: (x_bin_size, y_bin_size). If single number, the bin size in both directions
align: bool (default: True)- Pick bin edges at ‘round’ values if # of bins is provided
drop_outside: bool- True (default): Drop any data points outside the ranges
- False: Put any outside points in closest bin (i.e. edge bins include outliers)
colors: dict- Dict mapping ColorSupport -> Colormap (Default: FADE_IN)
border_line: Include a line along the axis in the output. Default Truefractional_tick_pos: Use various characters to indicate where an axis tick is, rather than just “-“ or “|”. Default Falsescale: True, False, or int- False: Do not upscale
- True: Upscale with defaults (max upscale of 3)
- Integer: Upscale with specified max scaling
plotargs- Extra arguments to pass to
Plotconstructor.
- Extra arguments to pass to
densitty.detect.densityplot2d(points, kernel, bins, ranges, align, **axis_args)
Also exported as densitty.densityplot2d()
Wrapper for smoothing.smooth2d / plot.Plot to simplify 2-D histogram plotting
points: Sequence of (X,Y) tuples- The data points to be smoothed
kernel: SmoothingFunc- The kernel to use for smoothing
bins: int or (int, int) or [float,…] or ([float,…], [float,…])- If int: number of output rows & columns (default: 10)
- If (int,int): number of columns, number of rows
- If list[float]: column (x) & row (y) coordinate values
- If (list[float], list[float]): column (x) coordinate values, row (y) coordinate values
ranges: Optional (ValueRange, ValueRange)- ((x_min, x_max), (y_min, y_max)) for the columns/rows
- If None (default): take from data.
align: bool (default: True)- Pick column/row centers at ‘round’ values
colors: dict- Dict mapping ColorSupport -> Colormap (Default: FADE_IN)
border_line: Include a line along the axis in the output. Default Truefractional_tick_pos: Use various characters to indicate where an axis tick is, rather than just “-“ or “|”. Default Falseplotargs: Extra arguments to pass through to plot function
densitty.detect.grid_heatmap(data, x_labels, y_labels, colors, max_cell_size, **plotargs)
Also exported as densitty.grid_heatmap()
Create a grid-style heatmap, with user-provided labels for each column and row.
data: Two-dimensional values (e.g. list of lists of floats)x_labels: list of stringsy_labels: list of stringscolors: dict mapping color support level to colormap. (defaultREV_RAINBOW)max_cell_size: int- maximum size of output cells. (default based on X label lengths)
plotargs: Extra arguments to pass through to plot function
densitty.detect.pick_colormap(maps)
Detect color support and pick the best color map
densitty.detect.plot(data, colors, **plotargs)
Wrapper for plot.Plot that picks colormap from dict
data: Two-dimensional values (e.g. list of lists of floats)colors: dict- Dict mapping ColorSupport -> Colormap (Default: FADE_IN)
plotargs- Extra arguments to pass to
Plotconstructor
- Extra arguments to pass to
densitty.lineart module
Character translations
ascii_font- Only use standard 7-bin ASCII characters
basic_font- Include very common non-ASCII characters present in VT-200 / MS-DOS
extended_font- Also include slightly less common characters
Color Maps
16-Color
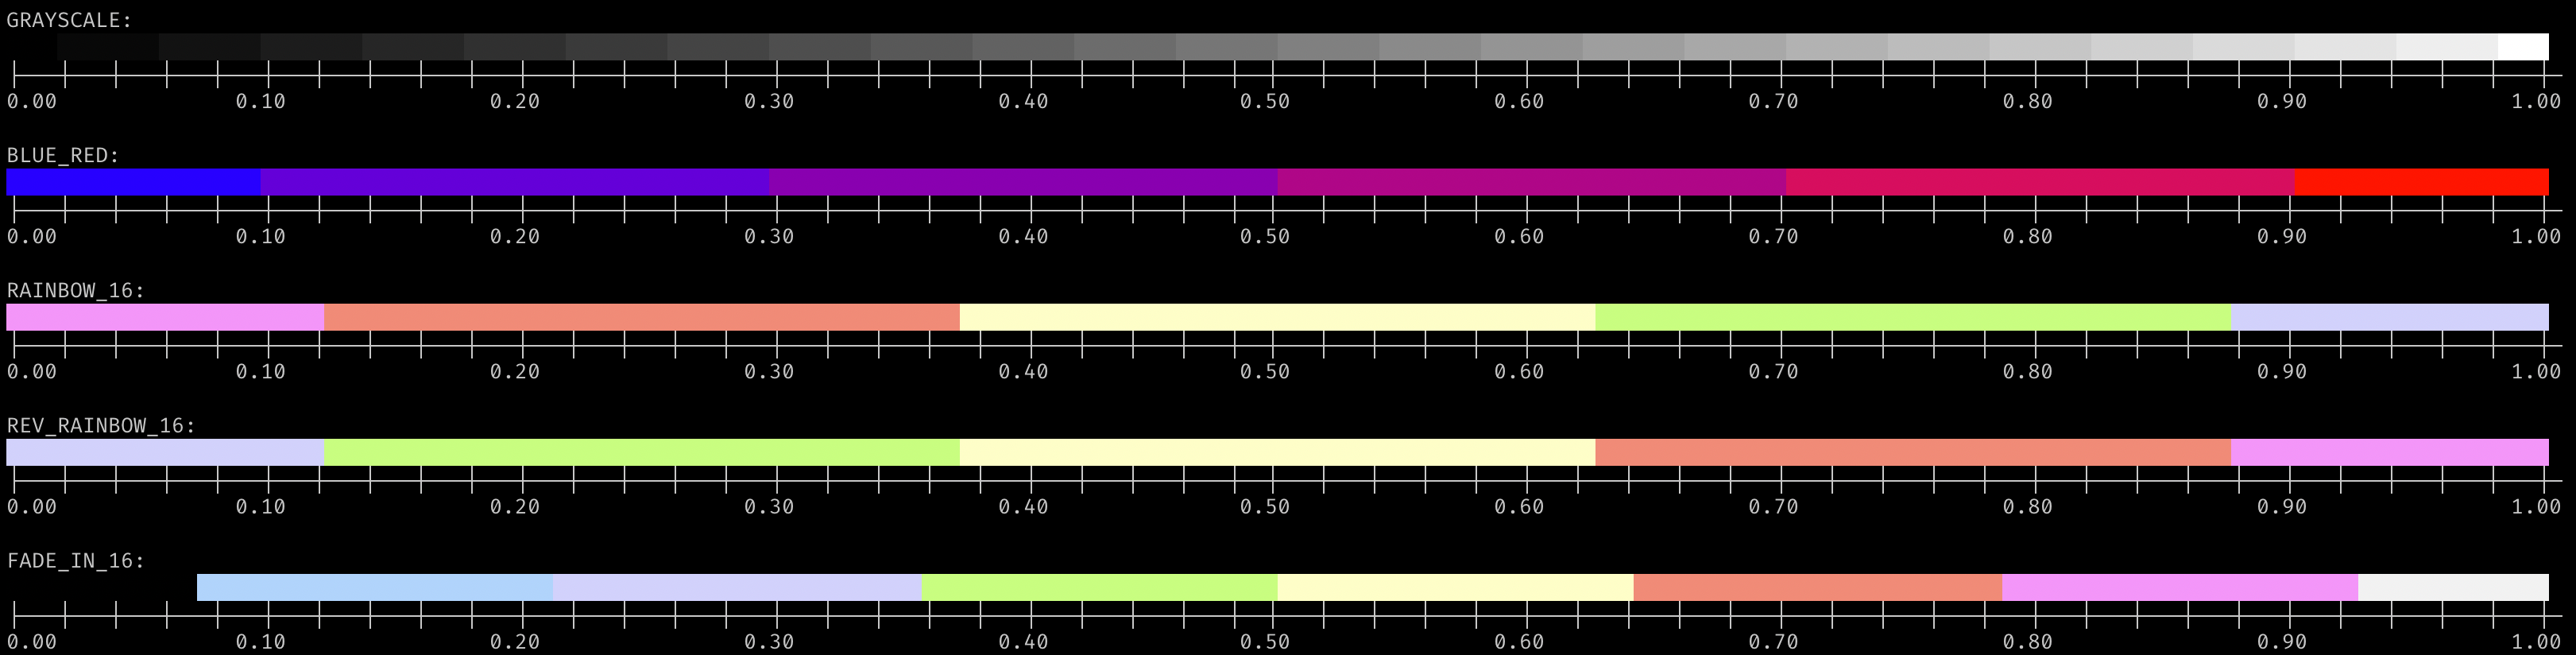 Note: these colors are typically user-configurable in terminal emulators, and can vary dramatically from this picture.
256-Color
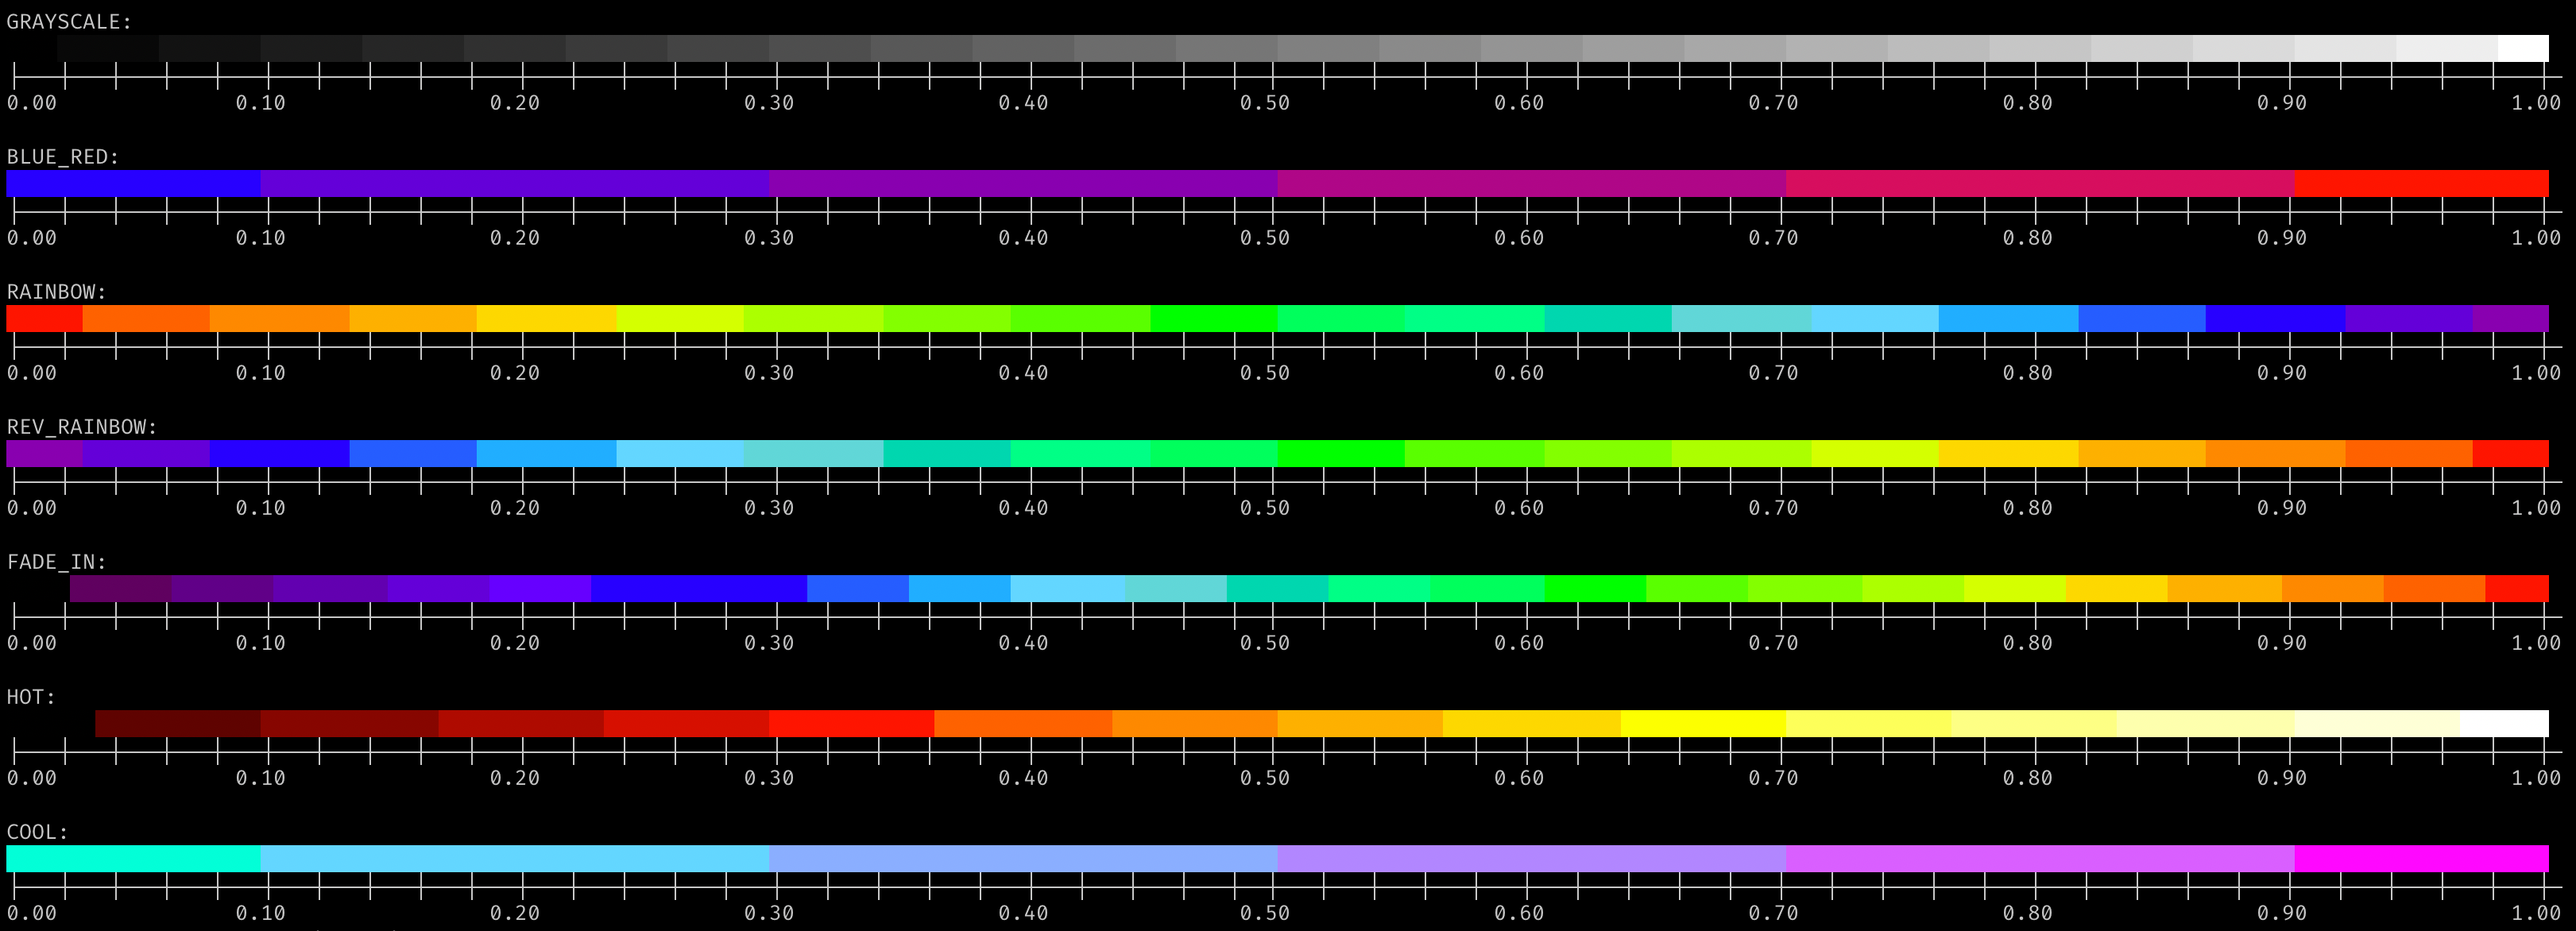 Note: these colors are often user-configurable in terminal emulators, and can vary from this picture.
24-bit / RGB / Truecolor
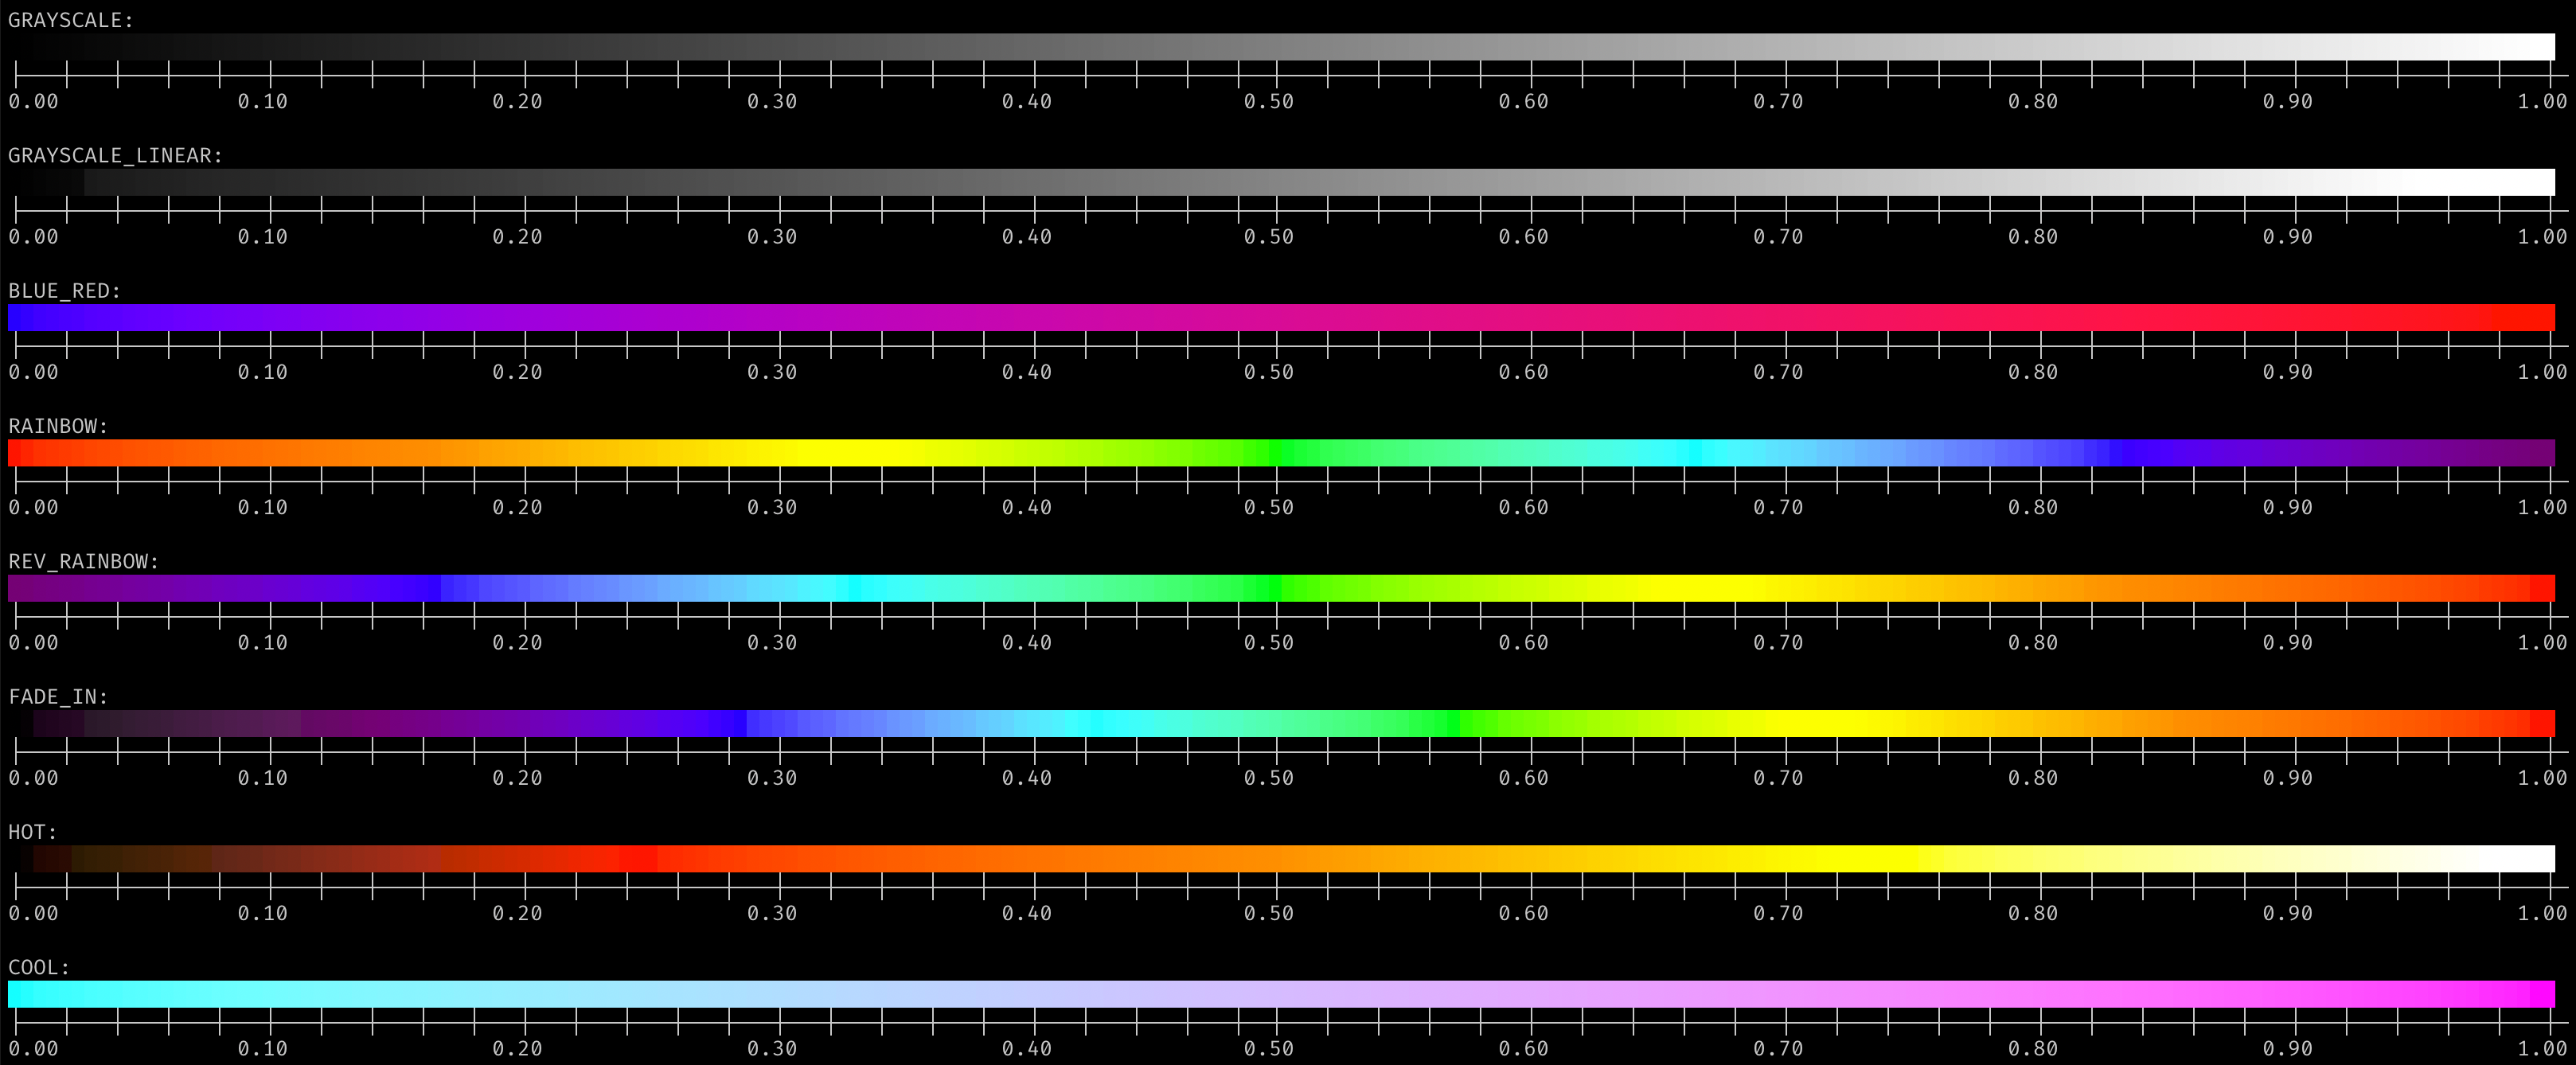 Note: less variable than 16-color or 256-color, appearance can still depend on the system, gamma correction, etc.
ASCII-Art
 Note: Different fonts can have different “densities” for these characters.
Custom color maps
These functions are used to create the above color maps. Using them to create your own is straightforward; see the code for examples.